Matlab VTK Scripts
VTK, the visualisation toolkit, can be used to view fluid flows in 3-D.
Here are two simple scripts for exporting array information from Matlab into VTK formats, which can then be visualised with software such as Paraview or MayaVi.
Scalar Data
function savevtk(array, filename)
%  savevtk Save a 3-D scalar array in VTK format.
%  savevtk(array, filename) saves a 3-D array of any size to
%  filename in VTK format.
    [nx, ny, nz] = size(array);
    fid = fopen(filename, 'wt');
    fprintf(fid, '# vtk DataFile Version 2.0\n');
    fprintf(fid, 'Comment goes here\n');
    fprintf(fid, 'ASCII\n');
    fprintf(fid, '\n');
    fprintf(fid, 'DATASET STRUCTURED_POINTS\n');
    fprintf(fid, 'DIMENSIONS    %d   %d   %d\n', nx, ny, nz);
    fprintf(fid, '\n');
    fprintf(fid, 'ORIGIN    0.000   0.000   0.000\n');
    fprintf(fid, 'SPACING    1.000   1.000   1.000\n');
    fprintf(fid, '\n');
    fprintf(fid, 'POINT_DATA   %d\n', nx*ny*nz);
    fprintf(fid, 'SCALARS scalars float\n');
    fprintf(fid, 'LOOKUP_TABLE default\n');
    fprintf(fid, '\n');
    for a=1:nx
        for b=1:ny
            for c=1:nz
                fprintf(fid, '%d ', array(a,b,c));
            end
            fprintf(fid, '\n');
        end
    end
    fclose(fid);
return
Vector Data
function savevtkvector(X, Y, Z, filename)
%  savevtkvector Save a 3-D vector array in VTK format
%  savevtkvector(X,Y,Z,filename) saves a 3-D vector of any size to
%  filename in VTK format. X, Y and Z should be arrays of the same
%  size, each storing speeds in the a single Cartesian directions.
    if ((size(X) ~= size(Y)) | (size(X) ~= size(Z)))
        fprint('Error: velocity arrays of unequal size\n'); return;
    end
    [nx, ny, nz] = size(X);
    fid = fopen(filename, 'wt');
    fprintf(fid, '# vtk DataFile Version 2.0\n');
    fprintf(fid, 'Comment goes here\n');
    fprintf(fid, 'ASCII\n');
    fprintf(fid, '\n');
    fprintf(fid, 'DATASET STRUCTURED_POINTS\n');
    fprintf(fid, 'DIMENSIONS    %d   %d   %d\n', nx, ny, nz);
    fprintf(fid, '\n');
    fprintf(fid, 'ORIGIN    0.000   0.000   0.000\n');
    fprintf(fid, 'SPACING    1.000   1.000   1.000\n');
    fprintf(fid, '\n');
    fprintf(fid, 'POINT_DATA   %d\n', nx*ny*nz);
    fprintf(fid, 'VECTORS vectors float\n');
    fprintf(fid, '\n');
    for a=1:nx
        for b=1:ny
            for c=1:nz
                fprintf(fid, '%f ', X(a,b,c));
                fprintf(fid, '%f ', Y(a,b,c));
                fprintf(fid, '%f ', Z(a,b,c));
            end
            fprintf(fid, '\n');
        end
    end
    fclose(fid);
return
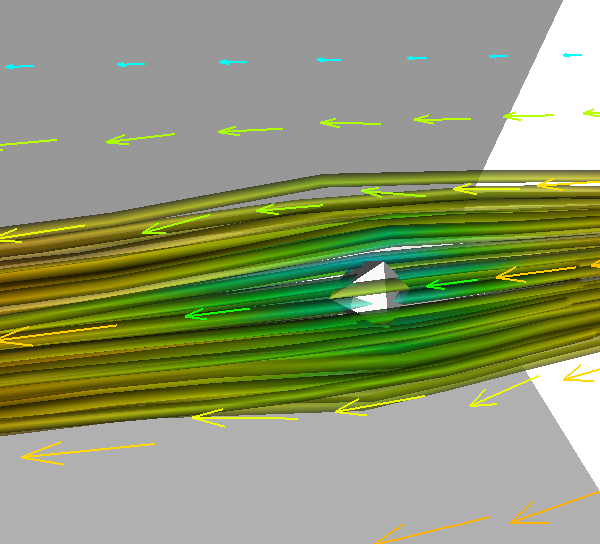
With those, some data, and VTK-based software, you can easily create images like this:
 Fluid flow as imaged by VTK using MayaVi, with data exported from Matlab.